General

How to Create Market Sizing Slides: TAM, SAM & SOM

Updated: May 20, 2025
How to Create Market Sizing Slides: TAM, SAM & SOM

Market sizing is a key component of any market analysis, pitch deck, or business case. Investors and business leaders want to know the scope of the opportunity as well as the share that you can realistically capture. 

In this post, we explain how to calculate TAM, SAM, and SOM and show you how to craft compelling market-sizing slides for your business (with examples and a template to get you started). We have also included a range of real-life examples as well as a few best practice tips based on our experience from McKinsey, BCG, and Bain. 
 

What is TAM, SAM & SOM

Let’s start with quick definitions of these three key metrics often used to size a market (often depicted as nested concentric circles, with SOM inside SAM inside TAM):

  • TAM (Total Addressable Market): The total possible revenue opportunity if your company captured 100% market share for your product/service (the “whole pie” with no competition).
     
  • SAM (Service Available Market): The portion of that total market that is relevant to your product or service – the slice of the pie that your offerings can serve given your business model and scope. In other words, it’s the segment of TAM that fits within your target geography, customer demographic, or product/service category.
     
  • SOM (Service Obtainable Market): The share of the SAM that you can realistically capture – essentially your target market share in the short term, considering your current resources, competitors, and constraints. 

These three metrics are hierarchical: TAM is the largest, SAM is a subset of TAM, and SOM is a subset of SAM. TAM gives a sense of the ultimate potential, while SAM and SOM help narrow that down to what your company can realistically address and achieve.

Total Addressable Market (TAM)

TAM represents the maximum market size (usually measured in annual revenue or unit sales) for your product or service if you had a monopoly and every potential customer was fully tapped. It’s essentially a “blue sky” number – aspirational and theoretical – since in reality, no company captures 100% of a market. Nonetheless, understanding TAM is useful to gauge the overall scale of the opportunity.
 

How to calculate TAM

When calculating TAM, there are a two common approaches you can take:

  1. Top-Down Approach – starting from broad industry figures and narrowing down.
  2. Bottom-Up Approach – building up from your specific target customer and pricing data.

Each approach can lead to a TAM estimate, and it’s often useful to triangulate between them. 

Let’s break down the two methods:


Top down approach

The top-down approach leverages high-level market data from industry reports or research firms (such as Gartner or IDC). You begin with a published total market figure—for example, "the global XYZ industry is valued at $50 billion"—then estimate the percentage relevant to your product or service. 

Top-down gives a big-picture sanity check. And while this method is quick and straightforward, it's often inaccurate. Data from general market reports may not precisely align with your niche, may be outdated, or lack specificity. Therefore, while top-down numbers provide a useful starting point, they should always be supported by more detailed, bottom-up analysis. 


Bottom Up Approach

The bottom-up approach is generally preferred because it’s grounded in actual data and assumptions you can defend. Bottom-up TAM calculation means adding up the specific components of your target market: start with the number of potential customers who fit your criteria, and multiply by how much revenue you can get from each on average. 

In simple form: TAM = (Number of Customers) × (Average Revenue per Customer) .

For example, imagine you sell a specialized medical software for hospitals with an annual license of $1,000. If there are 1,352 hospitals that could realistically use this software, then TAM ≈ 1,352 × $1,000 = $1.352 million per year. This bottom-up TAM tells a focused story: it’s based on concrete numbers (hospitals and price).

Bottom-up analysis tends to be more credible because you can show your work and tailor it to your business’s context. It forces you to identify your specific customer segments and pricing. Investors like this approach since it demonstrates you know your customer and value per customer, rather than just quoting a generic market size. 

Service Available Market (SAM)

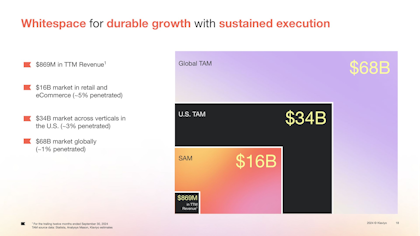
Once you have a good TAM estimate, the next layer down is SAM (Service Available Market). This is where we get more realistic about who actually might buy your product. SAM represents the portion of the TAM that is reachable and relevant to you, given your business model and current capabilities. In other words, no company can serve 100% of a broad market, either because of geographic limitations, differing customer needs, distribution model or product focus – so SAM carves out the slice you can serve.

For example, if your TAM includes every hospital in the country but your product is really tailored for private hospitals (due to certain features or pricing), then those private hospitals would constitute your SAM. SAM acknowledges that even though the total market is large, your service has a more limited addressable audience based on who would realistically be interested.


How to calculate SAM

Calculating SAM usually involves narrowing down your TAM by applying filters to your target criteria. Think of it as taking your TAM number and cutting out the portions that don’t fit your go-to-market plan. This is often a continuation of the bottom-up approach: start from the TAM (all potential customers) and subtract those that you won’t target (or can’t reach) initially.

Continuing our simplified example: TAM was 1,352 hospitals at $1,000 each. Now, assume your software is most suited for private hospitals. Say there are 695 private hospitals in the country. Those 695 at $1,000 each give a SAM of $695,000 per year. In other words, out of the whole market, about half of the hospitals are in the segment you’re focusing on – that’s your serviceable available market.

SAM can be defined by various factors: specific demographics, geographic regions, certain customer requirements, or distribution limits. The key is to be honest and realistic about who is truly in your target market. By doing so, SAM provides a more actionable market size for planning purposes than the pie-in-the-sky TAM.
 

Service Obtainable Market (SOM)

Finally, we arrive at SOM (Service Obtainable Market) – sometimes also called share of market. SOM represents what you actually expect to capture in the near term. It is the most granular and realistic of the three metrics. Think of SOM as your achievable piece of the pie given current constraints and competition. For an early-stage company, SOM often starts as a projection (or a goal), and for an established company, it can be measured as actual revenue or market share in your segment. 


How to calculate SOM 

If you’re already in the market, calculating SOM is straightforward: it’s your current market share of the SAM. For example, if the SAM (serviceable market) is $10M/year and last year your sales were $4M in that market, you held a 40% market share of the SAM. You can then apply that share to the new SAM to project your revenue. If this year the SAM grows to, say, $12M, your SOM projection (assuming you maintain a 40% share) would be 40% × $12M ≈ $4.8M. 

This method basically assumes you keep roughly the same slice of the serviceable market. If you plan to increase your market share (by outperforming competitors), your SOM could be higher – if you expect to lose ground, it should be lower.

For new startups without sales history, SOM is often an educated guess – you might say, “In our first year, we aim to capture 5% of the SAM, growing to 15% in three years,” or something along those lines. While SOM for a pre-launch startup is technically zero, founders do model hypothetical SOM scenarios to show ambition and a path forward. Just ensure any SOM claim is grounded in logic. SOM helps investors see your initial traction potential and how you’ll realistically penetrate your available market.

Market sizing tips from McKinsey and BCG

Even a seasoned analyst or consultant can fall prey to mistakes in market sizing. Based on our experience across projects at McKinsey and BCG, here are a few key tips and some common pitfalls to avoid when doing market sizing:

1) Bottom up is generally preferred to top down. 
When calculating market size, investors and executives generally prefer bottom-up analysis. If you slap a gigantic number from a research report on the slide (a top-down approach), it can easily come across as untrustworthy. Instead, try to show some evidence of original research: customer counts, competitor benchmarks, or usage figures that lead to your estimates. A bottom-up TAM figure, even if smaller than some top-down fantasy number, will carry more weight because it highlights your thinking and assumptions.

Structured Segmentation (MECE)
When market-sizing, a common best practice from McKinsey and BCG is breaking the market into clear segments (e.g., by demographic, usage, or product type) and then sizing each. It’s key here that segments are MECE (mutually exclusive and collectively exhaustive), meaning they don’t overlap and cover the whole market. 
Choosing the right level of detail in segmentation is also critical – too broad misses nuance, and too granular adds needless complexity. The goal is to capture key differences in customer behavior or access without overlooking any portion of the market.

3) Be clear on the geography. 
Always specify the geographical scope of your market numbers. Markets can be global, regional, or local. If you present a total addressable market (TAM) without specifying its geographic scope, an investor might assume it’s global and be alarmed if your number looks too low for a global market or too high if you only operate in one country. So, be explicit: e.g., “TAM = $5B (U.S. market)” or “European TAM” etc. If your business is initially focusing on, say, the European market, make sure your TAM and SAM are framed in that geography (don’t mix global TAM with a local SAM).

4) Provide Context and Comparisons.
Another effective consulting practice is to benchmark the market size against something familiar. For instance, “This $500M market is about the size of the sneaker market in Germany,” to give a sense of scale. BCG might compare the client’s current sales to the SAM: “Client’s revenue is $50M, which is only ~10% of the serviceable market – plenty of headroom.”

Resources for determining market size

Accurate market sizing requires research. Here are some the best resources and methods to help determine your TAM, SAM, and SOM:

  1. Analysis and research online: Leverage industry analyses, consulting reports, market research reports, and whitepapers available online. Just about every sector has analysts or thought leaders sharing data on trends, growth rates, and total market metrics. These resources help you understand broad market performance and can provide baseline numbers for TAM. (Tip: Look for market reports from firms like Gartner, IDC, Statista, consulting reports from McKinsey, BCG, PWC and Deloitte, or industry-specific publications)
     
  2. Financial reports: Examine the financial statements and investor reports of public companies in your market. Annual reports or 10-K filings often discuss market size and competitors. More importantly, seeing a competitor’s revenue can help you reverse-engineer their market share, giving insight into TAM and SAM. If a public competitor has 10% market share with $100M revenue, you can infer the overall market might be $1B, for instance. These figures help set benchmarks and realistic SOM goals. Additionally, industry trade associations often publish total industry sales, which can be useful for TAM estimates.
     
  3. Talk to people in the industry: Quantitative data is great, but sometimes insider knowledge is irreplaceable. Conversations with industry veterans, potential customers, or domain experts can reveal how the market is segmented, which segments are growing, and which customer groups are “low-hanging fruit.” Industry experts can often qualitatively validate (or challenge) your assumptions for TAM/SAM. They might point out niche sub-markets or customer segments you hadn’t considered. These insights help you refine what portion of the market is truly addressable for you.

By combining these resources – published data, competitor info, expert insight, and research tools – you can piece together a robust market size analysis. And remember, documenting your sources and assumptions not only helps ensure accuracy but also equips you to answer the tough questions when presenting your market slide.

Examples of Market Sizing Slides

Seeing how others have done their market sizing slides can be a great source of inspiration. We have collected some of the best below. 

Notice how some companies have incorporated trends and growth into their market slides, implying a rising tide that could lift the company's boat. Some slides also include key sub-segments, connecting the market sizing to the strategy.

sonos market sizing slide