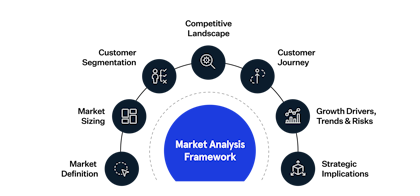
Product Strategy Deck: The MBB Consultant Cheat Sheet
Ex-McKinsey, BCG, and Bain consultants share their top tips for building standout product strategy decks. A practical cheat sheet for product leaders.
Mar 11, 2026

To craft a winning strategy, you must first understand your market. Where is the growth? How is value distributed across the value chain? Where are your competitors strong or exposed? Without this understanding, strategy becomes guesswork rather than a calculated path to advantage.
A robust market analysis turns data and research into actionable insights, enabling companies to anticipate trends, identify opportunities, and avoid potential blind spots.
Drawing on best practices from top consulting firms like McKinsey, BCG, and Bain, this post will guide you through a structured framework for creating a market analysis and provide a practical, step-by-step approach to executing it. The goal is to equip you with a simple playbook to analyze your market and form winning strategies for your business.
Most businesses have nearly unlimited options when deciding what to focus on. Should we enter this market, go after this customer segment, lower the price, or develop a new digital product? Market analysis is essential for answering these questions by turning market data and research into insights. Be it your strategy team, product development team, or even CEO, the insights offered by market analysis are fundamental to data-driven decision-making.
To ensure a comprehensive analysis, management consultants often use a structured Market Analysis Framework with seven core building blocks:

This seven-block framework ensures that a market analysis is MECE (mutually exclusive, collectively exhaustive) – covering everything from definitions and data to insights and action.
Now, let’s dive into each of the seven components of the Market Analysis Framework. For each block, we’ll discuss what inputs you need, which consulting frameworks or tools can help, key questions to answer, and indicators of a good analysis.
The foundation of your analysis, precisely describing the market you are studying and setting its boundaries. This involves defining the scope in terms of product or service, customer segments, and geography. For example, is the market “electric passenger vehicles in North America” or “global automotive market including electric and ICE vehicles”? The definition must be crystal clear.
Start by articulating the market in one sentence: “The market we analyze is […].” Be as specific as possible on:
Consultants often iterate on the market definition early on. A useful tip is to consider boundary cases: if you change the definition slightly, would the analysis still be relevant to your objective? This helps ensure you’re not defining the market too broadly (diluting relevance) or too narrowly (missing important adjacent spaces).
There isn’t a fancy tool or framework for this - it’s more about disciplined thinking. However, reviewing how industry research reports or competitors define the market can be very helpful.
You know you’ve nailed this step when everyone involved (your team, stakeholders) has a shared understanding of the market’s definition. In consulting, an explicit “Market Definition” slide often appears upfront to avoid any ambiguity.
Quantifying the market opportunity – your TAM (Total Addressable Market), SAM (Serviceable Available Market), and SOM (Serviceable Obtainable Market).
There are two primary approaches: Top-Down and Bottom-Up. Consultants often use both and triangulate.
See an in-depth guide to market sizing here: How to Create Market Sizing Slides: TAM, SAM & SOM
Your market sizing will be credible and decision-useful if it passes both the gut test and the scrutiny test. The gut test means the figures seem plausible (e.g., no one is shocked thinking "that number feels way off"). The scrutiny test means you can defend each figure: you have transparent calculations or reputable sources behind them.

Klaviyo market sizing slide showing TAM, SAM, SOM
This step is about breaking down the market into coherent segments and analyzing each segment's characteristics, needs and potential.
First, choose a sensible basis for segmentation. Common ways to segment include:
McKinsey often favors needs-based segmentation, as it directly ties to what drives purchasing decisions. For instance, in a B2B software market, segments might be "automation-focused adopters" vs "compliance-driven buyers" which speaks to their primary need/motivation. In consumer markets, you might identify segments by lifestyle or attitude (e.g., "tech-savvy early adopters" vs "value-conscious shoppers"). The key is that each segment is actionable, meaning you can take a specific action (such as tailoring marketing or product features) to serve that group better.
Once segments are defined, profile each one:
You might use the STP model (Segmentation-Targeting-Positioning) to structure the thought process: segment the market, identify which segments to target, and consider how to position for them.
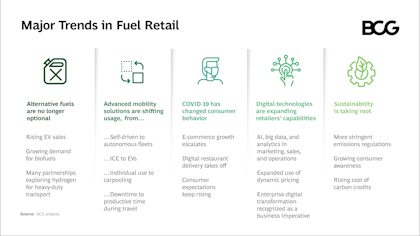
If data permits, cluster analysis or surveys can provide evidence for distinct segments (consultants love to include a chart of survey results showing, say, 3 clusters of customers with different priorities). Creating personas (fictional but research-grounded representations of segment archetypes) can also be useful for communicating who the segments are. Another tool is a simple table, with segments as rows and columns for the attributes above (needs, size, etc.), allowing for side-by-side comparison.
A strong segmentation will illuminate strategic choices. You know you've done it well if stakeholders start saying things like, "Wow, Segment X is where the profit is, but we've been too focused on Segment Y," or "We need a different approach to win Segment Z based on these insights." In other words, the segmentation leads to an "aha!" about where to play or how to tailor offerings. Also, each segment profile should feel like a real, distinct group – if the differences between segments are fuzzy or trivial, you may need to refine your definitions.

Segmentation slide summarising how an airliner segments the market for B2C leisure travelers. From Slideworks template
A competitive-landscape analysis is a structured evaluation of direct, indirect, and emerging rivals that reveals their strategies, strengths, weaknesses, and market positions. Adding a profit-pool lens shows where economic value is really captured along the value chain, not just who holds revenue share.
See this post for a full guide on how to do a competitive analysis: How to do a Competitive Analysis (6-Step Framework and Template)
The competitive analysis should yield strategic insight, not just descriptive data. A good analysis should give you a clear point of view on how to win. For instance, you might conclude "the market is saturated with low-price players, but no one is addressing the high-end segment," or "Competitor A is dominant in distribution channel X, so we should focus on channel Y," or "the profit pool is shifting toward aftermarket services – an area we should invest in."
This step examines how customers move from awareness to purchase and beyond. It's essentially mapping the buying process or funnel for your market, often now conceived as a non-linear journey. Understanding the customer decision journey helps pinpoint where you can influence the customer and how your marketing/sales process should align.
Lay out the typical stages a customer goes through in this market. Many consultants prefer to use a structured journey model, such as McKinsey's Consumer Decision Journey, which is circular rather than linear.

McKinsey's Consumer Decision Journey
Map out each phase:
When describing the journey, highlight pain points or drop-off points. For example, maybe many customers get stuck in the research phase due to too much information, or abandon carts at purchase due to price.
A customer journey map is the go-to tool. This is a visual flow of stages (often shown as a loop or linear timeline), with annotations of customer thoughts, questions, and feelings at each stage. You might also overlay touchpoints (e.g., "sees social media ad" at awareness, "compares specs on website" at evaluation, etc.). For a quantitative take, funnel metrics can be illustrated (e.g., 1000 people become aware, 200 enter evaluation, 50 purchase – a conversion funnel). Another useful framework is identifying Moments of Truth – the critical touchpoints that disproportionately influence the decision.
If you can tell the story of a representative customer journey clearly and identify leverage points, you've succeeded. Stakeholders should be able to empathize with the customer's experience after reading this.
This step zooms back out to the macro-level to identify what forces are driving growth or decline in the market. Essentially, it's about understanding the future trajectory of the market and the external factors that influence it - the "big picture" trends and uncertainties.
Begin by listing the major trends affecting your industry (many of these might have emerged in Step 1., the Industry Analysis, but here we focus on the forward-looking impact). Common categories of growth drivers include:
For each identified driver or trend, articulate how it impacts the market's growth or shape. Is it increasing total demand, shifting demand between segments, changing the cost structure, raising barriers, etc.?
Notably, a good analysis will not just list trends but prioritize the most impactful ones. If everything is a priority, nothing is. Highlight the top 3-5 drivers shaping the market's next 5+ years, and the top handful of risks that could change the outlook. Also, quantify where possible: "X trend is leading to Y% growth per year in this segment" or "If regulation Z happens, costs could increase by $N and slow adoption."
A trend impact analysis chart is often used to summarize findings: a 2x2 matrix of impact (high/low) vs certainty (high/low) to sort which trends to focus on.
This part of the analysis should prepare readers for the future. A strong trends and risks analysis might lead a company to make proactive moves, such as investing in a particular technology because the trend is inevitable, or hedging against a risk (like diversifying supply chains if a risk is identified there).

BCG slide summarising key market trends
The final step is the culmination of the analysis, translating all the findings into strategic insights and recommendations. It addresses the "So what?" and identifies how the company should act on this analysis. This section is where a market analysis report becomes truly actionable, bridging into the territory of strategy consulting.
Start by synthesizing the insights from all prior sections into a few key implications or recommendations. Essentially, answer: Given this market analysis, what should we do or not do? Some implications might be immediate strategic moves, others could be watch-outs for the future.
When forming implications, link them back to findings. For instance, "Because we found [this insight], we should consider [this action]." This traceability strengthens the logic.
If this final block is done well, the market analysis evolves from a report into a strategic plan, or at least the cornerstone of one. The true test is whether the CEO or decision-maker reads this section and knows exactly what to do next.
Conducting a thorough market analysis is half the battle; the other half is presenting it in a clear and compelling way so that stakeholders can act on it. Top-tier consultants rely on well-structured slide decks and templates to communicate findings. If you're looking to create a consultant-grade market analysis report, using robust templates and tools can significantly streamline the process.
Slideworks currently offers two different Market Analysis Templates - both created by ex-McKinsey, Bain & BCG consultants:
A comprehensive template containing 312 PowerPoint slides based on proven consulting frameworks, complete with storyline and best-practice slide layouts. The template contains five different sanitized, real-life cases showing different ways of conducting a market analysis with different purposes and different types of analysis and data input.
This template is ideal for:
A comprehensive template containing 458 PowerPoint slides based on proven consulting methodologies. This template includes four sanitized case studies showing what real-life market entry analysis reports can look like.
This template is ideal for:
If you'd like to dig deeper into the specific techniques mentioned in this article, these Slideworks guides are the perfect next step: