A quarterly business review is a recurring meeting where a team presents last quarter's results, progress against objectives, and next quarter's priorities to senior stakeholders. It answers three questions: what did we say we would do, what did we actually do, and what will we do next. The purpose is to create alignment and force decisions, not to report status.
Most QBRs fail that last test. They become 60-slide status parades where nothing is decided, and stakeholders leave wondering why the meeting wasn't an email. As this article from McKinsey explains, QBRs create real value only when they link strategic direction to team-level priorities, and inefficiencies creep in even when the process itself is run well.
In this article, we'll cover how to structure a QBR presentation section by section, what the individual slides should look like, and the formatting principles that make the difference between a QBR that gets decisions and one that gets polite nods and people leaving feeling like the meeting was a waste of time. The structure and examples come from the same methodology we used to run project and performance reviews during our years at McKinsey and BCG.
What is a quarterly business review?
A quarterly business review (QBR) is a structured meeting, held once per quarter, where a business unit, function, or project team reviews performance against objectives with leadership. A strong QBR covers four things: results versus targets, root causes behind deviations, decisions required from leadership, and committed priorities for the coming quarter.
The QBR is a decision meeting where the slides are the input that foster active discussion. If your QBR could be replaced by a circulated document, it is not yet doing its job. As McKinsey's org practice puts it, a well-run QBR acts as "the nerve center of the organization". In other words, the QBR is the forum where strategic signals get translated into what teams actually work on next quarter.
QBRs appear in several forms. Internal QBRs review a business unit or function against plan. Project QBRs review a transformation or program against milestones and budget. Customer QBRs, common in SaaS and professional services, review the value delivered to a specific client. This guide focuses on the internal and project variants, but the structure applies to all three.
QBR vs. board meeting vs. status report
These three formats are often confused, and the confusion produces bloated decks that try to be all three at once. They differ in audience, cadence, and what a "good outcome" looks like:
If a slide doesn't serve the QBR's purpose, i.e., reviewing performance and forcing decisions, it belongs in one of the other two formats, or nowhere.
How to structure your QBR presentation
The structure below is the one we've found most effective across hundreds of reviews in both Fortune500 companies and smaller startups. It follows the same logic as any well-built consulting deck: answer first, evidence second, ask third.
Note what is not in the main flow: activity lists, team shout-outs, and chronological recaps. Those belong in the appendix or in a different meeting.
How to create the QBR slides
1. Executive summary
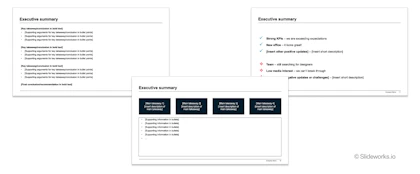
As the title suggests, this is your summary slide that you want to tailor to leadership. That means focusing on decisions and results, and leaving more background stuff out of it.
Specifically, state how the quarter went, why, and what you need from the audience. We recommend using the Situation-Complication-Resolution framework (see our post on how to write an executive summary).
A good trick to nailing the executive summary is to write it as a stand-alone slide and assume that main decision makers ONLY read that slide.
2. Scorecard
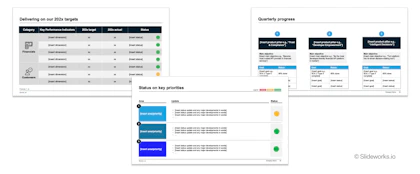
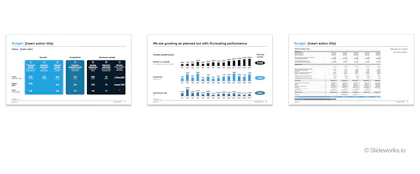
Show every KPI and OKR you committed to last quarter, each with target, actual, and status. Do not omit the misses or try to mask any embarrassing failures. A scorecard that only shows green erodes trust faster than a red rating ever will.
Keep the rating logic honest and consistent from quarter to quarter. If "amber" meant within 10% of target in Q1, it means the same in Q3.
3. Deep dives
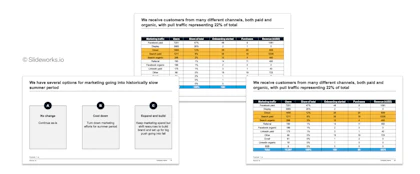
Pick the two or three deviations - positive or negative - that most affect the full-year outcome, and explain the root cause on one slide or two slides each. Use an action title that states the insight ("Churn rose because onboarding capacity lagged Q1 signups"), not a label ("Churn analysis"). See our post on how to write action titles like McKinsey for how you title slides in a best-practice way.
Resist any urge you may have to deep-dive on everything or expand the deep-dives to 5+ slides since this most often derails the meetings with time-consuming details or lost interest from the audience.
4. Financials
Include the budget versus actuals for the quarter, an updated forecast for the year, and the drivers behind any gap. Be very clear about where your numbers come from and highlight deviations with red, yellow, or green.
5. Risks and mitigations
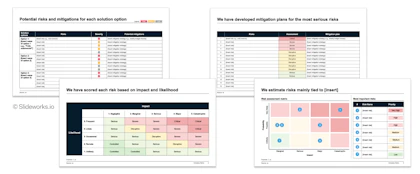
Focus on the risks that could move next quarter's results, ranked by likelihood and impact, each with a specific mitigation and owner. A risk without a mitigation is a worry, not a slide. Our risk mitigation slides guide covers the format in depth.
6. Decisions required
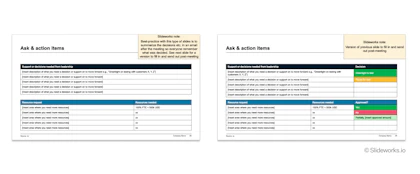
This is the slide most QBRs are missing, and it is the reason most QBRs feel pointless. List each decision you need, the options you've considered, your recommendation, and what happens if the decision is delayed.
If this slide is empty, question whether you need the meeting or if you could just send the other slides in an email.
7. Next quarter priorities
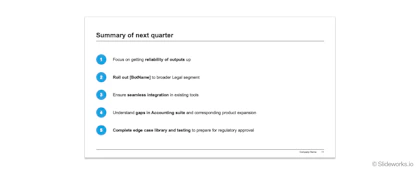
Close with the commitments for next quarter: three to five objectives, each with an owner, a measurable target, and key milestones. This slide becomes the opening scorecard of your next QBR, which is precisely what makes the QBR cycle self-reinforcing.
Reviewing OKRs in a QBR
If your organization runs on OKRs (Objectives and Key Results, a goal-setting method that pairs a qualitative objective with measurable key results), the QBR is where they should be reviewed and reset. BCG's work on scaling OKRs is explicit on this point: funding and capacity decisions should be connected to OKRs through quarterly and annual business reviews, giving leaders what BCG calls a "360-degree view on their strategy execution."
Two practices from BCG's research are worth adopting directly. First, assess OKR quality with a standard checklist - specificity, ambition, outcome orientation, customer focus, and non-binary measurability - so leaders can challenge weak OKRs quickly during the review. Second, keep the review focused on outcomes rather than activity. An OKR that reads "roll out the data platform" describes a means; the QBR discussion should be about the end, such as the customer satisfaction or revenue impact the platform was meant to produce.
The same logic applies even without formal OKRs. The Harvard Business Review Manager's Handbook frames goal-setting around a set of alignment questions; what metrics must the team hit for the company to succeed, and how does the unit's work ladder up to the organization's strategic objective. Your scorecard should make that line of sight visible with individual metrics, unit objectives, and company goals.
In our experience, the difference between a QBR that lands and one that drags is rarely the content, it's the packaging. These five principles or best practices are key to a great QBR:
- One consistent format, every quarter
Same section order, same scorecard layout, same rating logic, same slide templates. You want the audience to spend time on the content and by keeping a consistent format from quarter to quarter they know what to expect and are not confused by formatting.
- Action titles throughout
Even though it's a routine meeting, every slide should still include the main takeaways. This helps the audience quickly grasp the main takeaways. A great way to do this with routine meetings is to keep a consistent formatting of titles with the section:takeaway e.g., "Scorecard: IT costs 2.4x higher than anticipated" or "Deep-dive: IT costs driven in large part by unexpected costs of AI tools in standard workflows".
- Stakeholder-approved KPIs and things to watch
Go to your key stakeholders beforehand and align on the KPIs and main points or "things to watch" that you're planning to include in your QBR decks going forward.
In your meetings, notice if your audience consistently asks (i.e., more than once) on a specific topic or metric and include this as a standard point going forward. In the same vein, notice if any KPIs or topics are not really changing or seem redundant and remove them.
- Standardized data visualization
Use the same chart type for the same metric every quarter, keep axes consistent, and mark targets directly on the charts. A stakeholder comparing Q2 to Q3 should never have to re-learn how to read the chart and two charts should be directly comparable (again, this is why a consistent axis is important).
- Pre-wire the decisions
Share the deck, or at least the decisions-required slide, with key stakeholders before the meeting. Surprising a stakeholder in front of their peers is the fastest way to convert a supporter into a skeptic. The meeting should confirm decisions, not introduce them.
Common QBR mistakes
- Reporting without deciding: The deck recaps the quarter but asks nothing of the room. Fix: build the deck around the decisions-required slide.
- Scorecard amnesia: Each quarter's deck introduces new metrics, so nothing is comparable and no one is accountable. Fix: lock the scorecard structure and carry last quarter's commitments forward, visibly.
- All-green syndrome: Every rating is green until the annual numbers say otherwise. McKinsey's research on QBRs points to the underlying cause: without clear ownership of content quality, reviews drift toward reassurance. Fix: give the QBR a named owner responsible for process and content honesty, and define rating thresholds numerically.
- The 60-slide main deck: Everything the team did gets a slide. Fix: apply the structure above; if a slide doesn't support a decision or explain a deviation, move it to the appendix.
- Treating the QBR as an island: Priorities set in the review never connect to budgets or capacity. Fix: The QBR only works when funding and resourcing decisions run through it, not around it. Make sure it is directly connected to budget and resource discussions, and track these actively.
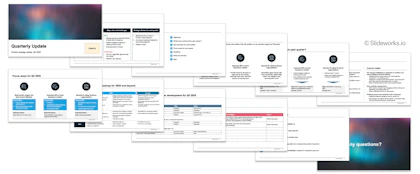
Free McKinsey-style QBR template
Download our free quarterly business review PowerPoint template with filled-in example text to get a headstart on your next QBR deck.
Download the QBR template now
Download now